
Issue 15 · August 24, 2026
Washington Escorted 660 Million Barrels. The Market Read It as a Ceiling.
On Friday the US military announced it had escorted 1,300 ships and more than 660 million barrels of crude through the Strait of Hormuz since early May. The same day, Iran's president said he wants the war to end.
This Week · Hormuz convoy ceiling · Russia fuel crisis · Gas at a 2023 high
Lead Story
Washington Escorted 660 Million Barrels. The Market Read It as a Ceiling.
Seven million barrels a day is the maximum output of the largest naval escort operation in decades. Before the war the strait moved twenty.
Brent crude, the benchmark price for most internationally traded oil, settled at 94.39 dollars a barrel on Friday 21 August, up 5.87 dollars and 6.63 percent on the week from 88.52 dollars, its highest close since July and a second consecutive weekly gain above 5 percent. West Texas Intermediate, the American benchmark, settled 87.06 dollars. TTF, the wholesale gas price that sets what European utilities pay, settled 65.87 euros per megawatt hour, the highest since January 2023, up 7.23 percent on the week and 96.18 percent on the year. On the same Friday, United States Central Command said it had helped roughly 1,300 commercial vessels move more than 660 million barrels of crude through the Strait of Hormuz since early May, with recent traffic implying about 7 million barrels a day over the past three weeks. Also on that Friday, Iranian President Masoud Pezeshkian said Tehran would prefer to conclude the war while it remains in a position of strength. Two headlines that should have taken money out of the price landed on the same day, and Brent closed the week 6.63 percent higher.
Do the arithmetic Washington did not print. 660 million barrels from the first of May to 21 August is 113 days, which averages 5.84 million barrels a day, and the best recent stretch runs about 7 million. Before the war the strait carried about 20 million barrels a day of crude and products. So maximum American naval effort, 1,300 escorted hulls and a standing blockade, restores roughly 35 percent of normal flow. That is not a recovery curve, it is a capacity measurement, and the market repriced it as one, because the binding constraint is escort tonnage rather than Iranian permission and no signature in Muscat adds ships to the Fifth Fleet. The other side of the ledger is about to get worse. On Monday 24 August, Treasury Secretary Scott Bessent presents what President Trump has called an economic D Day, aimed at countries that keep buying Iranian crude, and China takes more than 80 percent of Iran's seaborne barrels. The official model has not caught up. The EIA August Short Term Energy Outlook still has Brent averaging 78 dollars in the fourth quarter of 2026, 16.39 dollars below Friday's screen and about 17 percent. Brent holds above 90 dollars through the end of the third quarter and that gap widens before it closes. For a European driver the week added roughly 3 euro cents to the crude cost of a litre of fuel before tax and refining margin, and heating oil futures ended Friday 94.74 percent above a year earlier against Brent's 39.36 percent.
Chart · The Forecast the Market Has Already Left Behind
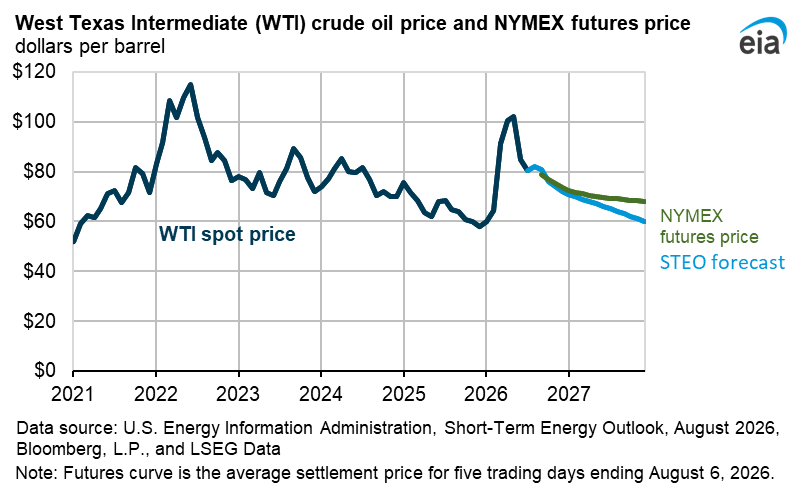
West Texas Intermediate spot price in dollars per barrel from January 2021 to early August 2026, with the NYMEX futures curve and the EIA forecast running to the end of 2027. The chart stops before the week this issue covers, and that is the point. Its forward path is built on futures settlements for the five trading days ending 6 August 2026, and it has WTI drifting from the high seventies down toward sixty dollars through next year. WTI closed Friday 21 August at 87.06 dollars, above where the forecast begins. The official curve is not describing this market, it is describing the one that ended two weeks ago. Source: US Energy Information Administration, Short Term Energy Outlook, August 2026, with futures data from Bloomberg and LSEG.
That is not a recovery curve, it is a capacity measurement, and the market repriced it as one, because the binding constraint is escort tonnage rather than Iranian permission and no signature in Muscat adds ships to the Fifth Fleet.
Geopolitics
The Drone Campaign Finally Bit. It Bit Russian Drivers First.
Seventeen percent of Russian refining is down and Moscow has banned petrol exports until 2027.
Reuters calculates that Ukrainian strikes have now disrupted at least 17 percent of Russia's oil refining capacity, hitting ten refineries and halting roughly 1.1 million barrels a day of processing, with the campaign landing at the peak of Russian summer fuel demand. By 17 August fuel sale restrictions had spread again to nearly all of Russia, with queues reported from the south to Primorye. Russian refinery runs fell to a 24 year low in early August, and Moscow extended its ban on petrol exports to 31 January 2027. Read that as a European, not as a spectator. Russia has removed itself as a fuel exporter from a world that has already lost close to 5 million barrels a day of refinery throughput against last year. The diesel crack spread, the margin between the cost of crude and the price of the diesel made from it, set a record 102.20 dollars a barrel on 17 August, the first triple digit print in its history, and settled in triple digits the next day. American distillate stocks, the pool Europe now imports its shortfall from, sit near 107.1 million barrels, the lowest for the time of year since 1996. Washington asked Kyiv in August to stop hitting tankers and did not ask it to stop hitting refineries. The half of the campaign that was permitted is the half that has started working, and it arrives in Central Europe as a haulage invoice rather than a headline.
In Focus · Storage
Europe Tried to Time the Gas Market. The Tape Says It Lost.
Storage sits at 62 percent, the target was moved to meet it, and the price is at a three year high.
European Union gas storage was close to 62 percent full on 20 August against about 74 percent on the same date a year earlier, the lowest seasonal level in records that begin in 2009. The reason is not a physical failure, it is a trade that went wrong. Utilities and traders held back from injecting through the summer because prices were elevated and they expected them to fall. TTF closed Friday at 65.87 euros per megawatt hour, the highest since January 2023 and 96.18 percent above the same week last year. Brussels has relaxed the mandatory end of summer storage target from 90 percent to 80 percent and the European Commission says supply is not at immediate risk. The volumes that were supposed to close the gap are sitting at sea. European Union buyers hold roughly 21.5 billion cubic metres of contracted Qatari liquefied natural gas for 2026, about 6.3 percent of the bloc's 2025 gas demand, and the blockade has stranded a large part of it. A terminal shows you 65.87 euros. It does not show you that the target was lowered to match the outcome rather than the outcome raised to meet the target, and that every point of the 12 point gap against last year is gas Europe will now buy in January at January prices.
Take Action
Five Signals to Watch This Week
Concrete checkpoints between now and the next issue.
- Watch the Bessent press conference on Monday 24 August. The number that matters is not the rhetoric, it is whether the measures reach major Chinese banks rather than only the teapot refineries already sanctioned, because that is the difference between a signal and a barrel.
- Track the CENTCOM escort figure, not the headline. It ran near 380 million barrels in early July, 500 million in late July and 660 million on 21 August, and the increment rather than the total tells you whether the convoy operation has hit its ceiling.
- Read the EIA Short Term Energy Outlook when it publishes on 9 September. August left Brent at 78 dollars for the fourth quarter against Friday's 94.39, and a third consecutive increase confirms the model has stopped treating this war as temporary.
- Follow the diesel crack rather than Brent. It printed 102.20 dollars on 17 August against a pre crisis norm of 15 to 25 dollars, and it is the input to European haulage, farming and heating costs.
- Check EU storage weekly on the AGSI+ dashboard. At 62 percent on 20 August against 74 percent a year ago, the number to watch is the daily injection rate, because the heating season starts on a fixed date whether or not the tanks are full.